Figures
All figures are pre-rendered PNGs produced from the LCA package by
scripts/generate_table_and_figures.py. They sit in
docs/_generated/figures/ and are committed alongside the source.
Plotly support
Zensical v0.0.43 does not yet ship a first-class Plotly integration,
so this prototype uses matplotlib / seaborn with PNG export.
Embedding a Plotly figure would mean inlining its <script> block
via a partial in overrides/.
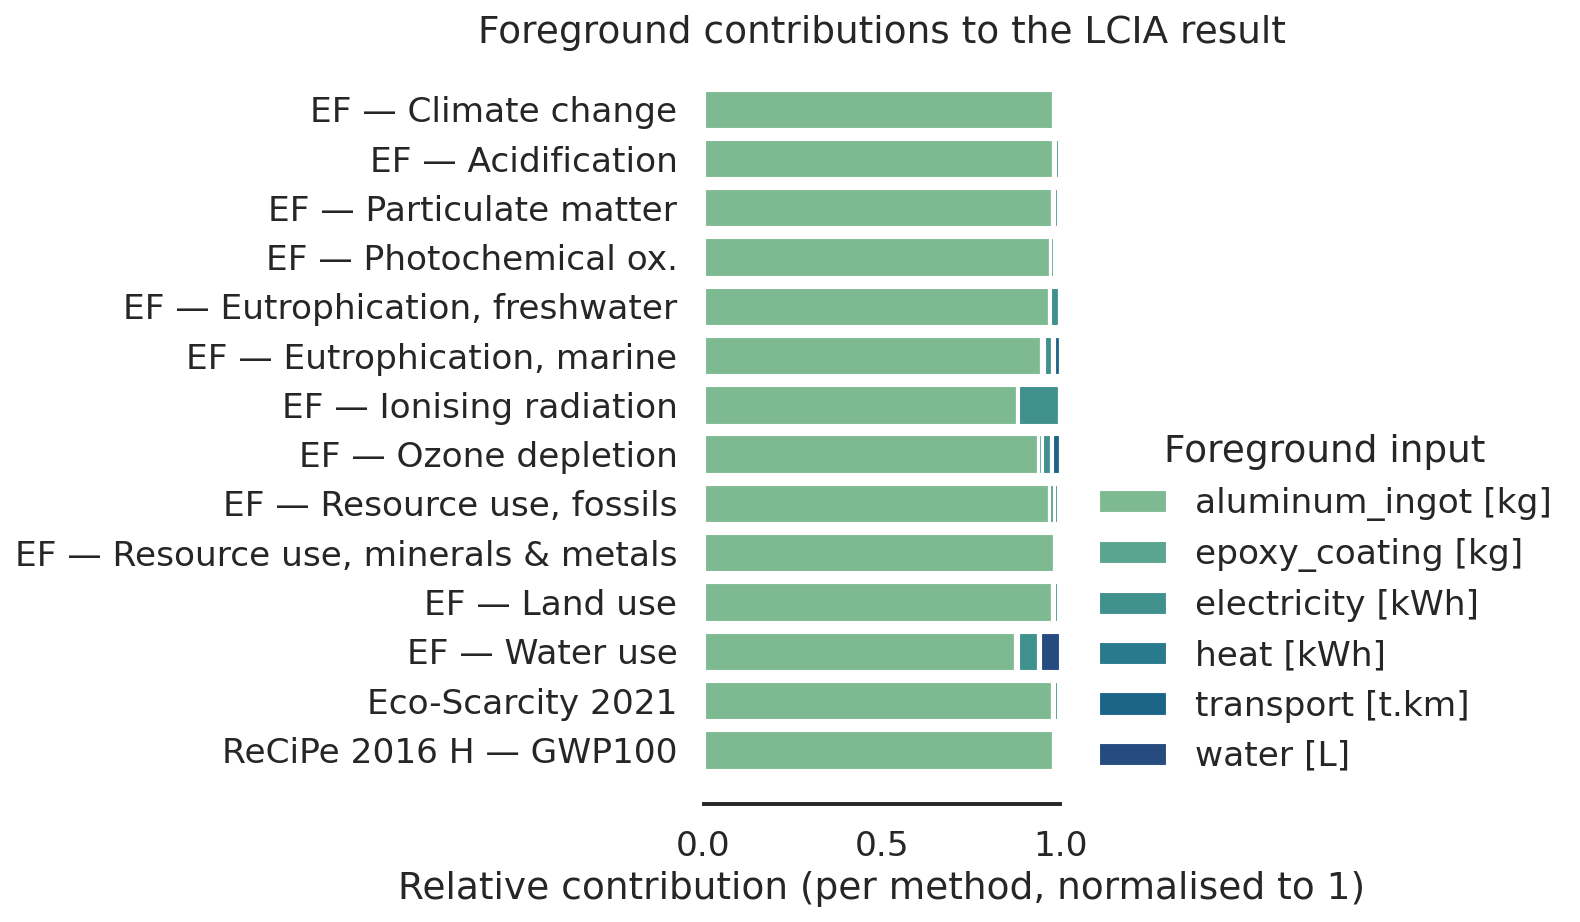
Foreground contributions, all methods
For every impact method the bars sum to 1, so they show where each unit of impact comes from. Aluminum dominates almost every category, which is the headline finding of any aluminum-bottle LCA.
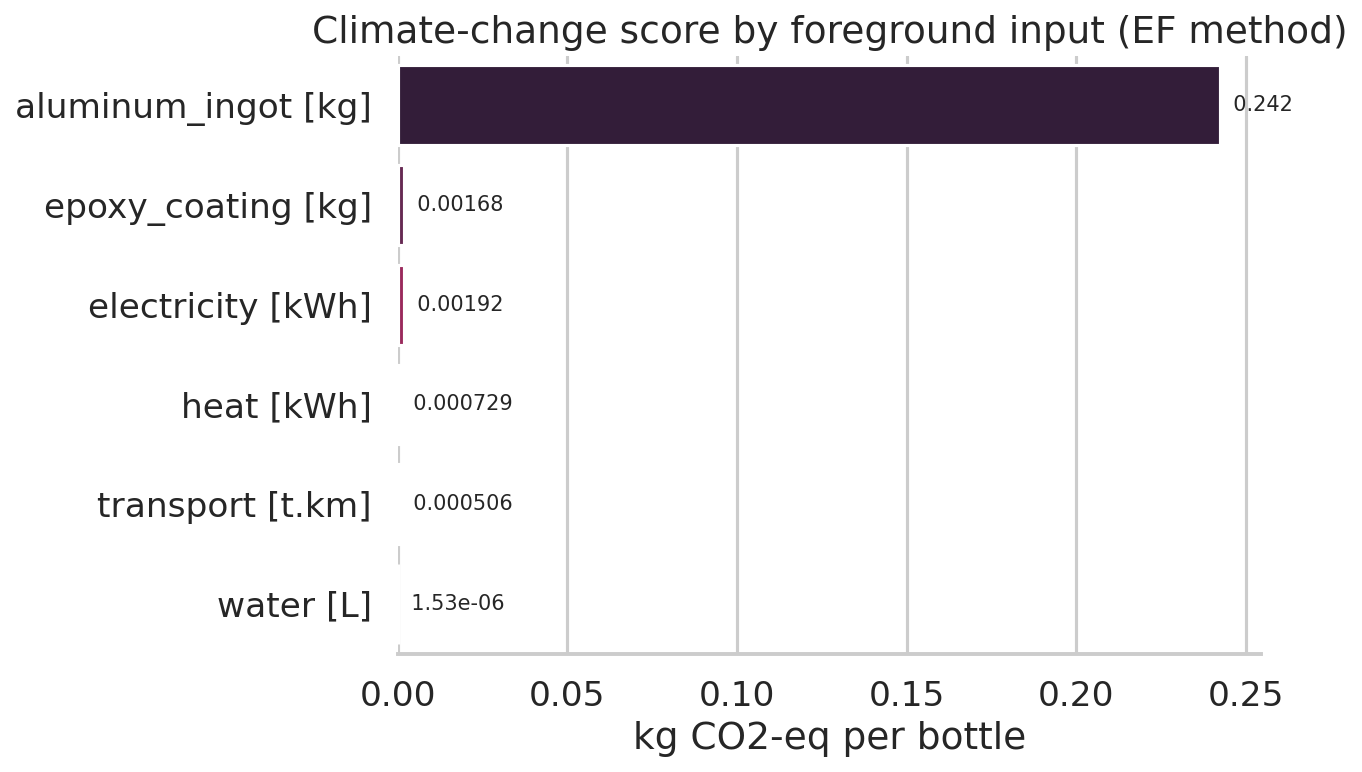
Climate-change score per foreground input
Absolute numbers in kg CO2-eq for the EF climate-change method. The log-of-the-eye reading is "the aluminum bar dwarfs everything else."
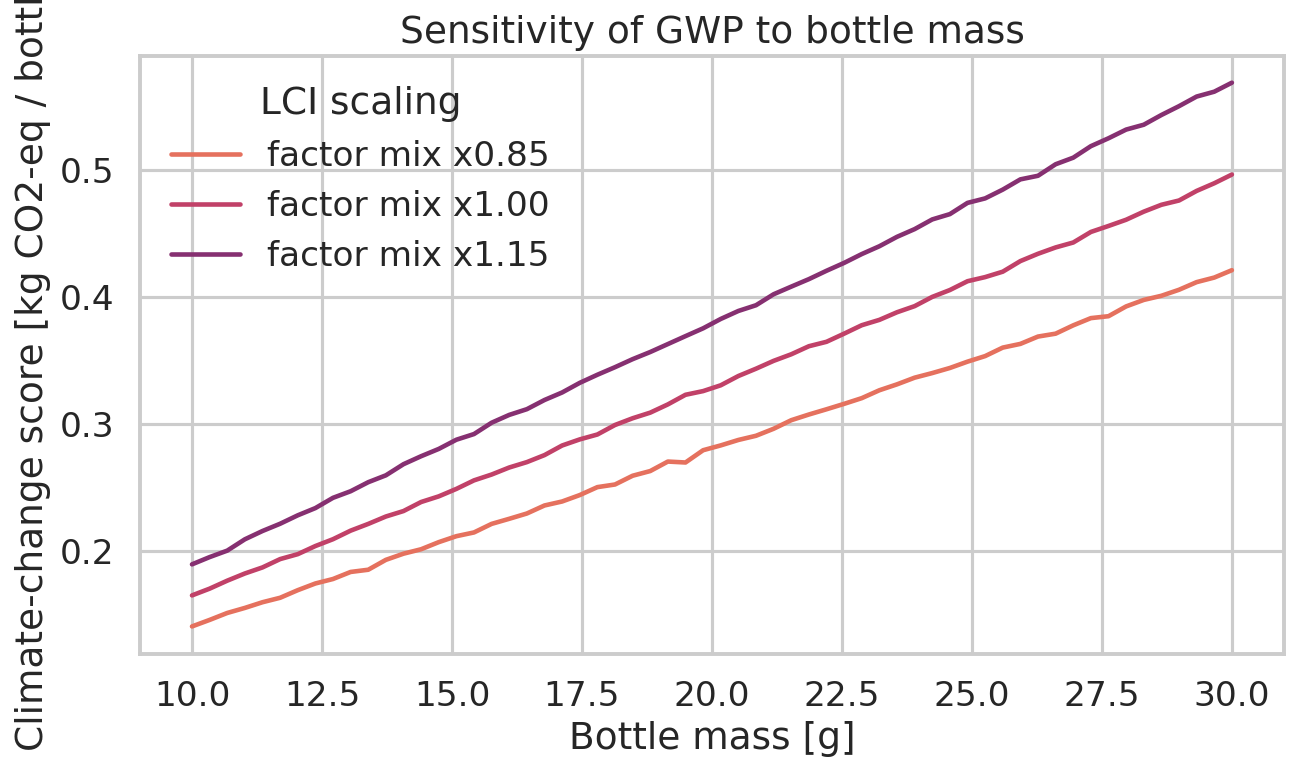
Sensitivity of GWP to bottle mass
Linear scaling, by construction — the model has no non-linear terms in bottle mass. The three lines correspond to a uniform multiplicative perturbation of the characterisation-factor mix.